Challenge:
- The pharmaceutical company struggled to track and analyze sales performance across various products and regions.
- They had fragmented data sources and lacked a comprehensive view of their sales metrics, making it difficult to identify trends and make informed strategic decisions.
Solution :
We developed a comprehensive dashboard that integrated data from multiple sources into a single platform. This dashboard included detailed sales metrics, trends, and visualizations, such as trend lines, bar charts, and pie charts, to present the data in an accessible and visually appealing manner. By providing a holistic view of their sales performance, the dashboard enabled the client to identify high-performing products, regions with growth potential, and areas needing improvement. This enhanced visibility allowed the company to optimize their sales strategies and drive growth.
Executive Summary
The Pharmaceutical Dashboard Development project aimed to create an intuitive and comprehensive platform to monitor and analyze key metrics within the pharmaceutical industry. This dashboard covers three critical areas: sales, product performance, and Labour efficiency. The goal was to provide stakeholders with a user-friendly interface that presents complex data in an accessible and visually appealing manner, supporting informed decision-making and strategic planning.
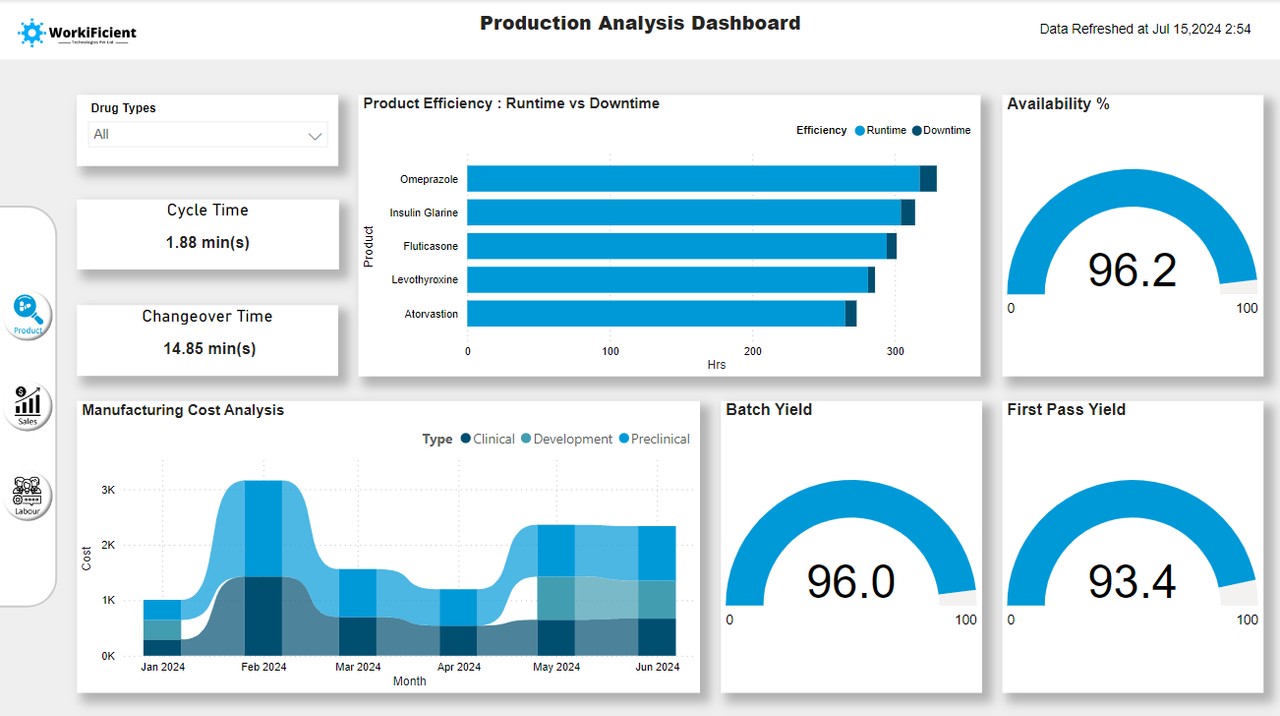
1. Product Page
Project Details:
- Completion: The product page was finalized with comprehensive product information, performance analytics, and visual representations.
- Content: Includes detailed descriptions, performance metrics, and visualizations like product lifecycle charts and sales by product category.
- Accessibility: Data is presented in a manner that is both accessible and visually appealing, ensuring users can easily interpret the information.
Visualizations:
- Product Performance (Line Chart): Tracks product sales and performance over time.
- Product Lifecycle (Flowchart): Visualizes the stages of each product from development to market.
- Sales by Product Category (Pie Chart): Shows the distribution of sales across different product categories.
Purpose:
- To provide detailed insights into product performance and lifecycle.
- To assist in product strategy development and inventory management.
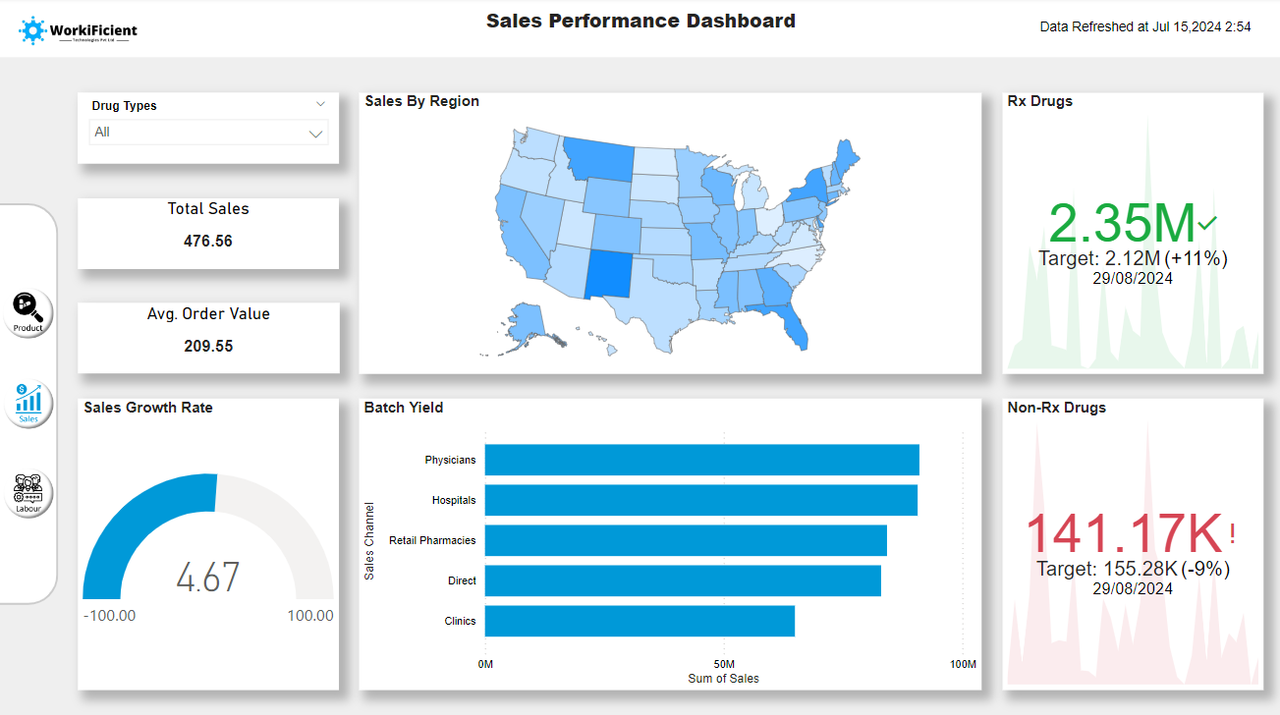
2. Sales Page
Project Details:
- Completion: The sales page was completed with full formatting, ensuring a polished and professional look.
- Content: It includes detailed sales metrics, trends, and visualizations such as line charts, bar charts, and KPIs.
- User-Friendliness: The layout is designed to be user-friendly, making it easy for users to navigate and quickly grasp key data points.
- Key Metrics: Metrics include total sales, sales growth over time, regional sales distribution, and top-performing products.
Visualizations:
- Sales Trends (Line Chart): Tracks sales performance over time, identifying peak periods and trends.
- Regional Sales Performance (Map): Highlights sales distribution across different regions, aiding in regional strategy planning.
- Top Products (Bar Chart): Shows the top-selling products, helping to identify product strengths and market demand.
Purpose:
- To provide a quick and clear snapshot of the company’s sales performance.
- To support sales strategy development and identify areas for improvement.
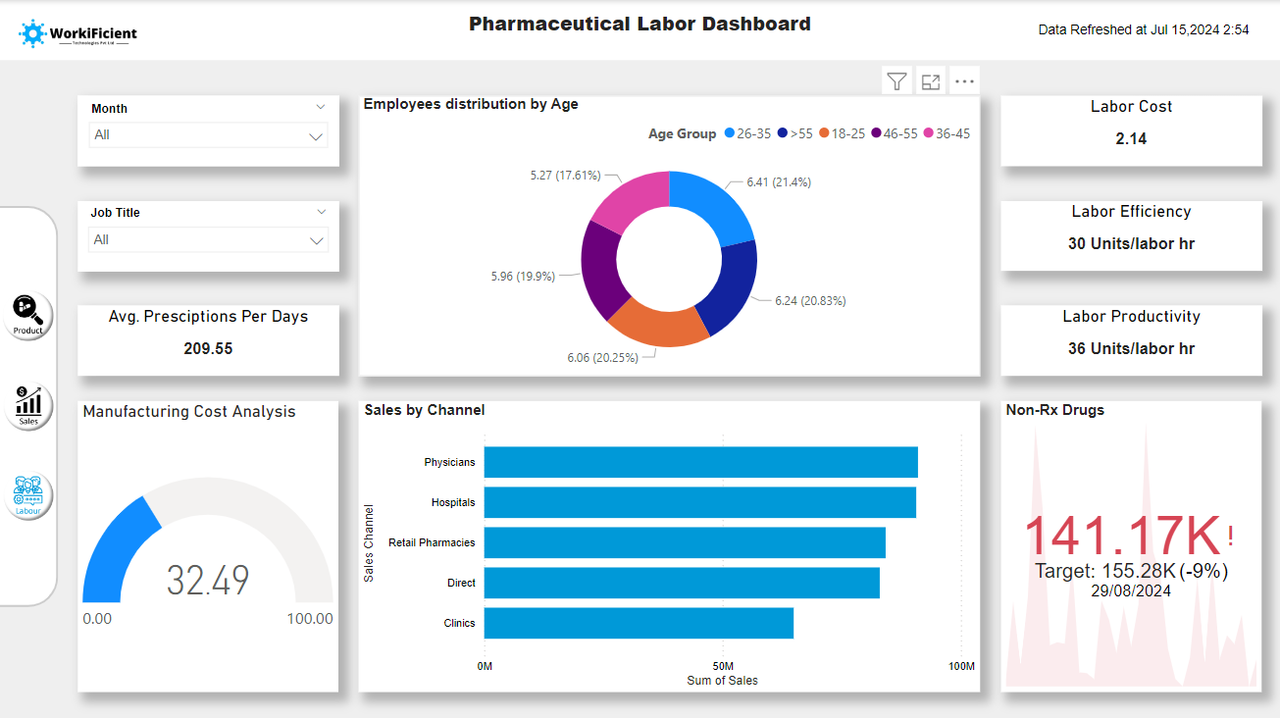
3. Labour Page
Project Details:
- Completion: The Labour page was finished, incorporating detailed Labour statistics, efficiency metrics, and visual formats.
- Content: Includes metrics on Labour efficiency, productivity, and workforce distribution.
- Structure: The page is well-structured to provide clear insights into Labour data, supporting workforce management and optimization.
Visualizations:
- Labour Efficiency (Bar Chart): Compares Labour efficiency across different departments or regions.
- Productivity Metrics (Gauge): Monitors overall productivity levels and identifies areas for improvement.
- Workforce Distribution (Pie Chart): Shows the distribution of the workforce across various roles and departments.
Purpose:
- To provide comprehensive insights into Labour efficiency and productivity.
- To support workforce management and identify areas for operational improvement.
Conclusion
The Pharmaceutical Dashboard Development project successfully delivered a comprehensive and user-friendly platform that integrates sales, product, and Labour data into a single, cohesive interface. Each page—Sales, Product, and Labour—was meticulously designed to present key metrics and insights through intuitive visualizations and well-structured layouts. This dashboard empowers stakeholders with the information needed to make informed decisions, optimize operations, and drive strategic initiatives.